Dashboard reporting
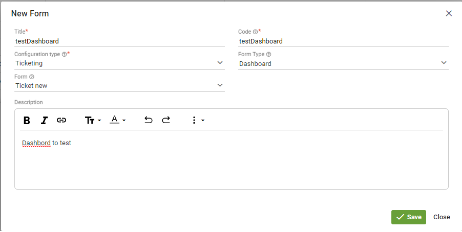
When creating a dashboard, the following general parameters must be set: Title, Unique Code (for a quick search), Configurations type (for logical grouping dashboards in form management), and Form type.
Use these components to add reports to the dashboard: the Pivot report and the Pivot chart:

These components can be used as other visual controls in the containers.
Use the Component properties section for customized reports.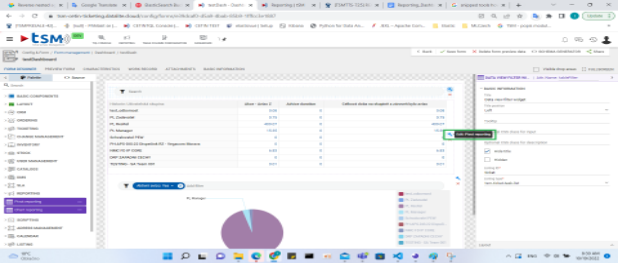
The main property value is Script wich contains a list of all created reports. The user can choose a prepared report and add it to the dashboard.
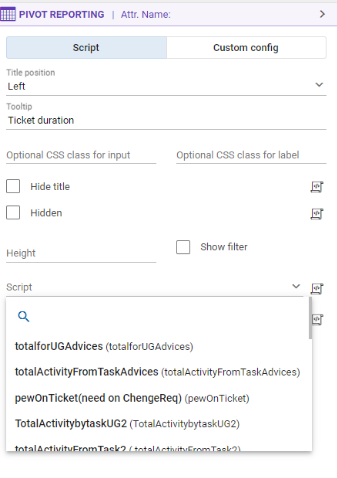
To edit users open the report in the report editor from the dashboard properties area:

After editing and saving a new version of the report, the user should save and refresh the dashboard in the browser.
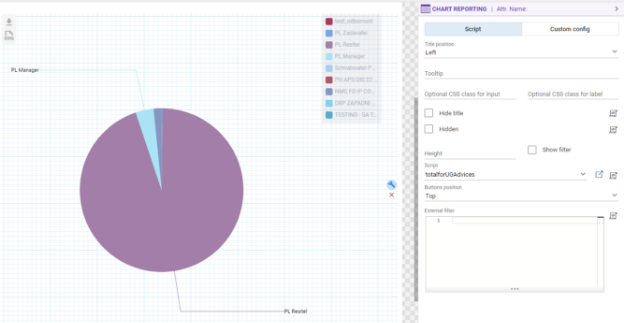
A Pivot chart report is created and edited in the same way as a pivot report. The difference is that the pivot chart visualizes the chart view of the report.
DASHBOARD FILTERS
Dashboard pivot reports support two levels of filters:
- The filter for one component:
- The common filter for all components with the component filter widget
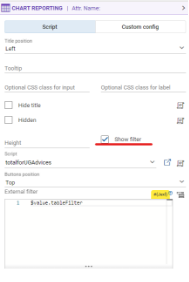
To apply the common filter the user should take the following steps:
- Add the widget to the dashboard from the palette

- Choose the Attr. name of the widget, listing type, and add also unique listing ID
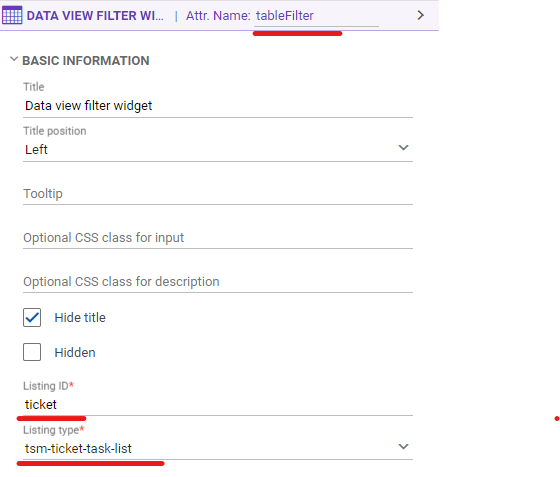
- Apply externalFilters value in the Source to configure the components which should be filtered
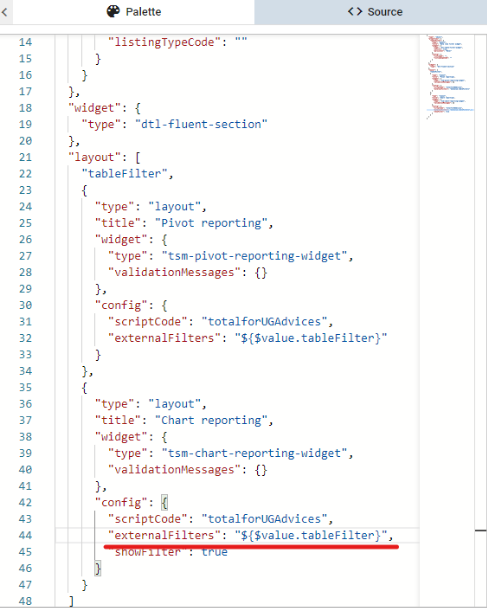
For additional info about the Source configuration, see the Source documentation.