Additional features
ORDERING
These values can be applied to rows and columns:
- Ascending and descending

FUNCTIONS
-
The FIRST function - to show the first value in the list (or non-converted value)
-
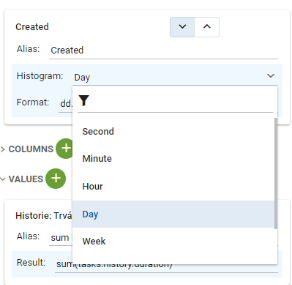
Histogram with the format of the date
The histogram function supports fields with the date type values.
- users can choose the range
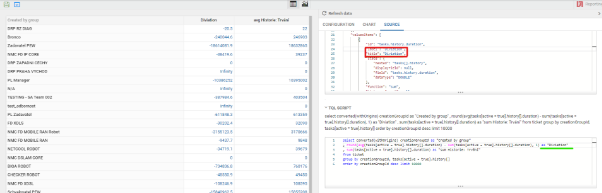
SOURCE CUSTOMIZATION
The Source tab contains tools for table and chart handling.
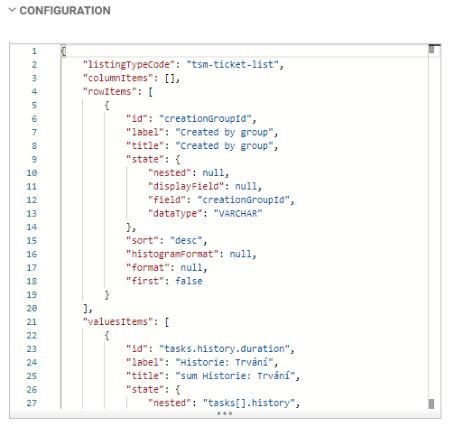
There is a JSON document with table configuration in the Configuration section, where the user can change the titles of fields and other parameters similar to the Configuration tab.
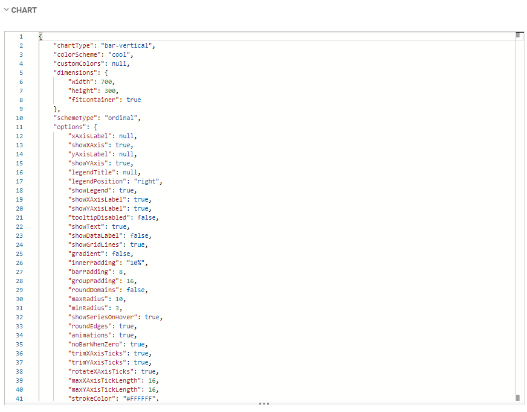
The Chart section contains the source for the charts which also could be edited manually and similarly to the Chart tab. These params contain all params which are enabled for the current chart type.
tQL section contains the current tQL script of the query to elastic search. The user can Copy/Paste the code to the editor and make changes to tQL.
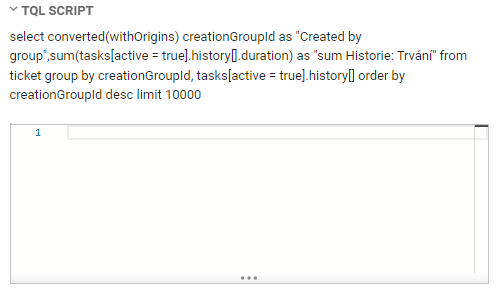
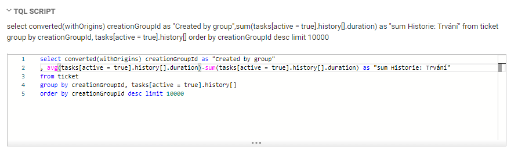
NOTICE! When the user changes tQL manually, the following steps should be taken:
- Push the Refresh button to see changes
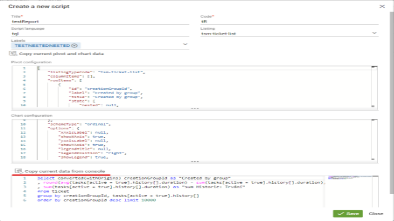
- This code should be copied in a separate section in the Save Dialog for saving.
If the user adds additional columns in the report by the tQL script, it should be added to the source in the Configuration section. Visual report filters can’t be applied to the report while editing the tQL script. The filters can be applied only in the script code.
- and format of the dates visualization.

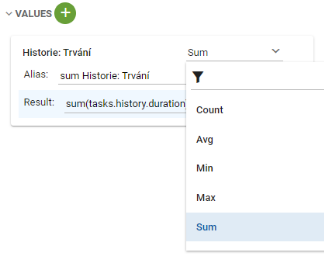
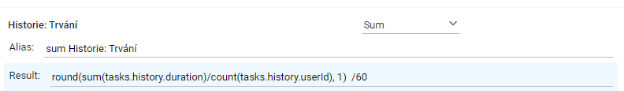
- Aggregation support
Aggregation functions such as AVG, SUM, MAX, MIN, and COUNT are supported for numbering data values.
As an additional feature, there is thensupport of the arithmetic operation and round function.
The user can combine two agg functions in one expression.
For string-type values tSM reporting supports COUNT and FIRST aggregation.
