Monitoring and Alerting
Prometheus (Metrics Collection)
Prometheus is used for metrics collection from various tSM services. It collects time-series data via HTTP pull requests and allows for alerting and advanced query analysis using the PromQL query language.
- Version: Latest
- Functionality: Time-series database, metrics collection, and alerting.
- PromQL: Enables complex queries for data analysis.
Grafana (Visualization)
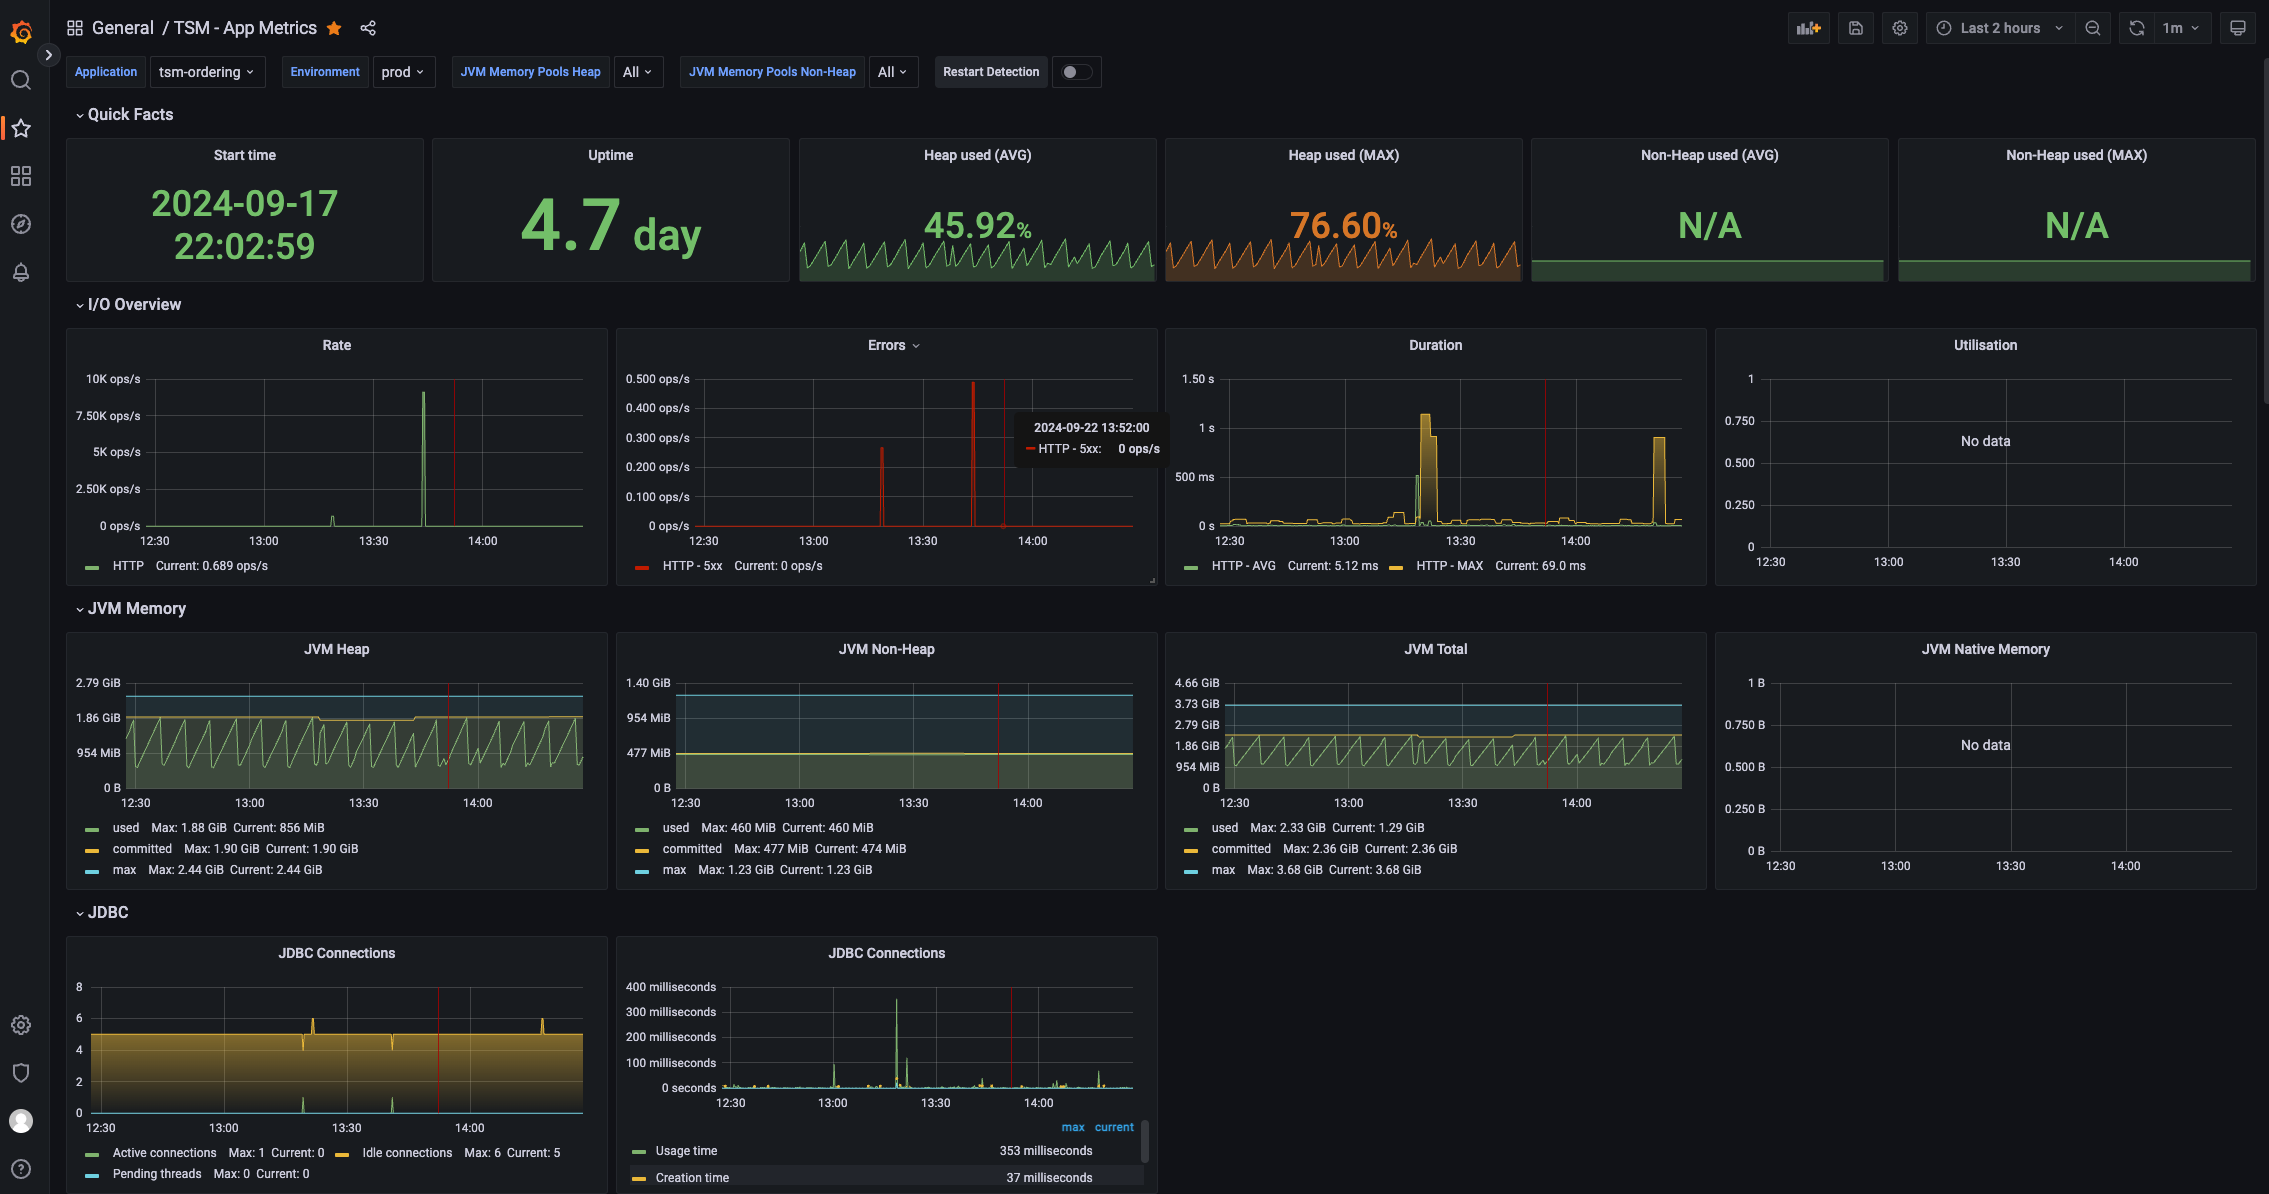
Grafana is integrated with Prometheus to provide rich visual dashboards for real-time monitoring of metrics. It allows users to create custom dashboards that visualize various system metrics and performance indicators.
- Version: Latest
- Functionality: Data visualization, interactive dashboards.
- Integration: Prometheus, ElasticSearch.
Example Grafana Dashboard with tSM Metrics:
Kibana (Log Visualization)
Kibana is used for visualizing logs collected by ElasticSearch. It provides powerful querying and filtering capabilities to analyze logs and monitor system behavior in real time.
- Version: 8.5
- Functionality: Log analysis and real-time visualization.
- Integration: ElasticSearch.
Zabbix (Server Monitoring)
Zabbix is used for monitoring server infrastructure, including CPU, memory, and network usage, as well as the health of the deployed containers and services.
- Version: Latest
- Functionality: Monitoring of server and network resources.
- Alerting: Provides notification via email, SMS, or custom scripts based on pre-defined rules.
Business Metrics
In addition to standard technical metrics, tSM also tracks business metrics, which provide insights into key operational performance indicators. These metrics allow monitoring of core business functionalities such as the number of orders, average order processing time, and other service-specific KPIs.
- Examples of Business Metrics:
- Number of Orders: Total number of orders processed in the system.
- Average Order Processing Time: The average time it takes for an order to be processed from initiation to completion.
- Order Success Rate: Percentage of orders successfully processed versus those that failed.
These business metrics are visualized alongside technical metrics in tools such as Grafana, providing a holistic view of both system performance and business operations.
tSM Management Microservice
The tSM Management Microservice plays a crucial role in managing and adjusting system configurations dynamically. This service allows operators to override default settings or adjust processing behavior based on business or operational needs. For instance, users can manually adjust the number of parallel Kafka consumers or pause order processing during system maintenance.
- Override Features:
- Pause/Resume Processing: Manually pause or resume the processing of certain services or queues.
- Adjust Parallel Consumers: Increase or decrease the number of parallel consumers for services such as Kafka, based on current system load.
For more details on the tSM Management Microservice, refer to the tSM Management Service Documentation.
Dynamic Scaling and Service Suspension
Based on the available system and business metrics, tSM supports dynamic scaling and automatic suspension of processing activities. This ensures that the platform can adapt to changing conditions in real time.
-
Dynamic Scaling:
- Metrics like CPU utilization, memory consumption, or business indicators such as processing times can trigger the automatic scaling of services to meet demand.
- Kafka consumers or microservices can be scaled up or down based on traffic and load metrics, ensuring efficient resource usage.
-
Service Suspension:
- In scenarios where a downstream system becomes unavailable or overloaded, tSM can automatically pause processing to avoid further issues. For instance, if a downstream system responsible for processing Kafka messages becomes unavailable, tSM can stop consuming from the Kafka queue to prevent backlog buildup.
-
Declarative Configuration:
- Dependencies and scaling behaviors are declared in tSM's configuration files, allowing customization based on business needs. Additional logic for project-specific implementations is added as needed.
Through the tSM Management Service, administrators can manually override these behaviors, such as increasing the number of parallel consumers or pausing processing to align with business priorities.